Click on the images to get a high resolution version.
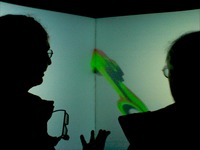
 A terrain visualization software, eqSmart, on the 24 megapixel display wall at
the University of Zürich (7680x3200)
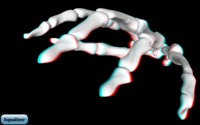
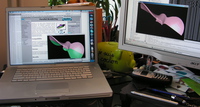 eqPly running on a MacBook Pro using a Windows XP machine as a rendering
client in a sort-last configuration.
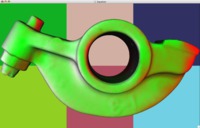
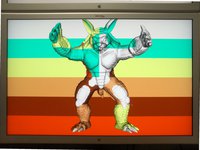
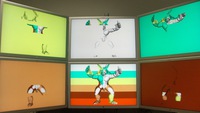 A six pipe sort-last, direct-send configuration using channel colors to
illustrate the database decomposition (model patches) and the parallel result
composition (background)
Volume data set courtesy of Computer Graphics Group, University of Erlangen,
Germany. 3D models courtesy
of Cyberware, Stereolithography Archive
at Clemson University
and Stanford University
Computer Graphics Laboratory.

